Document Actions
Waste - State & Impacts (SOER 2010)
The policy on waste in Belgium is under regional jurisdiction.
The policy on waste in Belgium is under regional jurisdiction. Since many indicators are differently defined or calculated in the three regions of Belgium, most indicators are calculated separately for the three regions instead of calculating one Belgian indicator.
Because the amounts of industrial waste are calculated in different ways in the three regions of Belgium, the regional amounts of industrial waste are reported separately.
The treatment of municipal waste in the Flemish Region.
Key message
The proportion of municipal waste incinerated has remained fairly constant since 2000. The proportion composted/recycled increased slightly and the proportion of municipal waste landfilled decreased between 2000 and 2008, from 13 to 24%
Figures
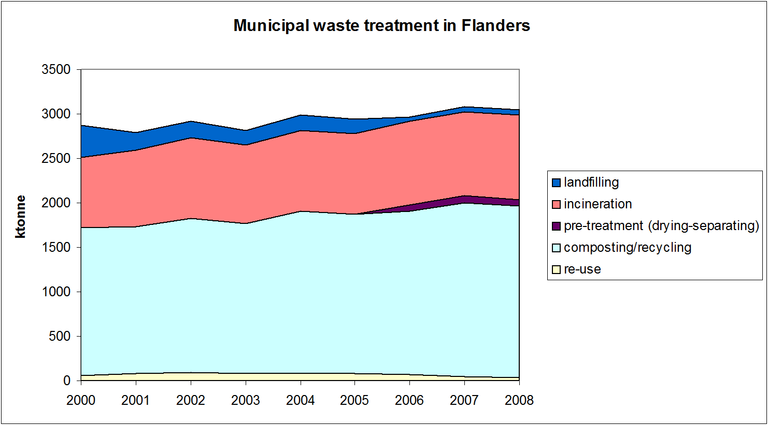
Figure 1: Municipal waste treatment in the Flemish Region
- Data source
- http://www.ovam.be/jahia/Jahia/cache/off/pid/176?actionReq=actionPubDetail&fileItem=2211
Fullscreen image Original link


Municipal waste is all waste collected by the municipalities. It contains selectively collected waste streams (glass, paper and paperboard, metals, construction and demolition waste) and residual waste. This residual waste contains also litter, waste from the litter bins in the streets and bulky waste.
|
amount of municipal waste |
|||||||||
|
(ktonnes) |
2000 |
2001 |
2002 |
2003 |
2004 |
2005 |
2006 |
2007 |
2008 |
|
re-use |
59 |
82 |
94 |
87 |
86 |
83 |
75 |
44 |
38 |
|
composting/recycling |
1661 |
1654 |
1733 |
1678 |
1815 |
1785 |
1829 |
1954 |
1922 |
|
pre-treatment (drying-separating) |
0 |
0 |
0 |
0 |
0 |
1 |
77 |
81 |
76 |
|
incineration |
786 |
860 |
909 |
886 |
914 |
914 |
936 |
950 |
955 |
|
landfilling |
362 |
197 |
188 |
168 |
175 |
161 |
45 |
50 |
56 |
|
total |
2868 |
2792 |
2924 |
2819 |
2990 |
2944 |
2962 |
3079 |
3047 |
Of the total amount of municipal waste collected in 2008, 1 % went to re-use, 63 % to composting or recycling, 2 % towards pre-treatment (drying-separation), 31 % to incineration with energy recovery and 24 % to landfills.
The proportion of municipal waste incinerated has remained fairly constant since 2000. The proportion of waste composted/recycled increased slightly, from 58 to 63%.
The proportion of municipal waste landfilled decreased between 2000 and 2008, from 13 to 24 %. Since 1 January 2006 the ban on landfilling for non-recyclable flammable municipal waste has been more strictly applied.
The treatment of municipal waste in the Walloon Region.
Key message
The quantity of municipal waste going directly to pre-treatment centres is increasing. On the other hand, the quantity of municipal waste going directly to incinerators and to landfill keeps on reducing.
Figures
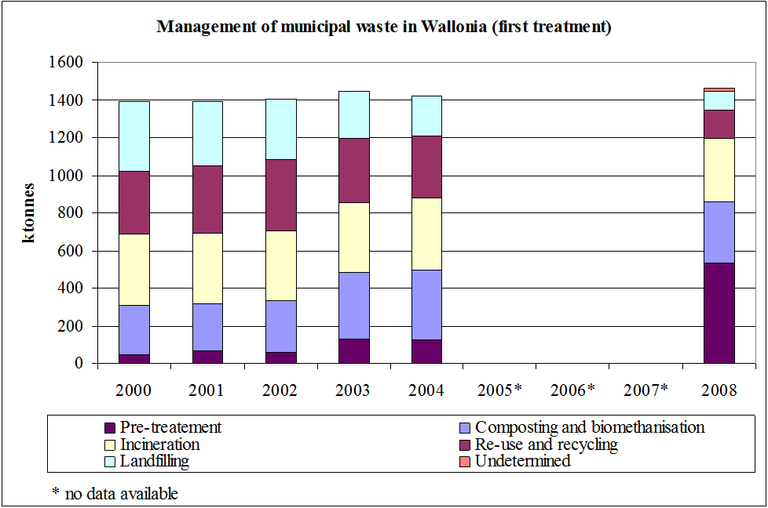
Management of municipal waste in the Walloon Region (first treatment)
- Data source
- http://etat.environnement.wallonie.be
Fullscreen image Original link
")
The data concern municipal waste (household waste and household like waste, excluding sewage sludge and construction and demolition waste to match with the definition of municipal waste of Eurostat). Household like waste is collected together with household waste by municipalities or intermunicipal companies. It is waste from shops, small enterprises, schools or municipalities for example.
The proportion of municipal waste going directly to pre-treatment centres is increasing. In 2008, almost 36 % of municipal waste was sent to pre-treatment centres.
On the other hand, the proportion of municipal waste going directly to incinerators and to landfills keeps on reducing, mainly because of take-back obligations, the ban on landfilling of certain types of waste, the application of a new tax decree (from 2008 only practices aimed at waste valorisation are no longer taxed) and subsides given for implementing separate collection.
| Management of municipal waste - first treatment (ktonnes) | |||||||||
| 2000 | 2001 | 2002 | 2003 | 2004 | 2005 | 2006 | 2007 | 2008 | |
| Composting and biomethanisation | 265,6 | 250,6 | 271,4 | 352,1 | 370,6 | No data available | 324,0 | ||
| Re-use and recycling | 338,3 | 356,7 | 376,3 | 337,0 | 328,7 | 153,2 | |||
| Incineration | 370,7 | 377,7 | 369,4 | 372,1 | 383,1 | 333,1 | |||
| Landfilling | 368,3 | 341,3 | 323,9 | 251,4 | 212,9 | 101,6 | |||
| Pre-treatement | 47,8 | 65,7 | 61,1 | 131,3 | 124,8 | 534,3 | |||
| Undetermined | 0,0 | 0,0 | 0,0 | 0,0 | 0,0 | 18,8 | |||
| Total | 1390,6 | 1391,9 | 1402,1 | 1443,9 | 1420,1 | 1465,0 | |||
The treatment of municipal waste in the Brussels-Capital Region.
Key message
The proportion of municipal waste incinerated decreased since 2000 (-12%) despite a quite important increase of the population (+9%). During the same period, the proportion composted/recycled increased from 14% to 23% and the proportion of municipal waste landfilled (out of Brussels)decreased from 5 to 3%.
Figures
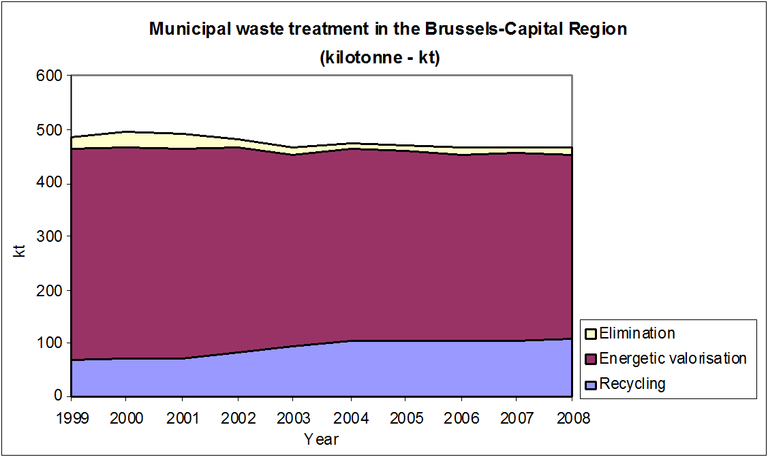
Municipal waste treatment in the Brussels-Capital Region
- Data source
- http://www.bruxellesenvironnement.be/Templates/Particuliers/informer.aspx?id=3956&langtype=2060%20
Fullscreen image Original link

Data sources
- Bruxelles Environnement - Leefmilieu Brussel (IBGE - BIM)
- Rapport administratif 2007 de l'agence régionale pour la propreté (French)
- L'état de l'environnement bruxellois
- Staat van het leefmilieu in Brussel
- "Summary report of the state of the environment 2007-2008" p.27
- "Synthese van de staat van het leefmilieu 2007-2008" p.25 (Dutch)
- "Synthèse de l'état de l'environnement 2007-2008" p.25 (French)
either. In addition, there may also be an underestimation due to lack of data on communal container parks which are not available before 2006 and represent around 25 000 tonnes. Those 25 000 tonnes are not included in the table below.
Re-use concerns a small stream, collected by the social economy or from the container parks. There are no significant data about those streams. Seven major streams of municipal waste are recycled: PC, PMC, green waste, glass, metal, wood and WEEE. All those sorted streams are sent out of the region for treatment, except for green waste which is treated in a centralised compost plant. There is no landfill in the Brussels-Capital Region and the residual waste is burned in the regional incineration plant (with energetic valorisation). Bulky waste which can not be re-used or recycled is sent to disposal out of Brussels.
|
Amount of municipal waste (ktonnes) |
2000 |
2001 |
2002 |
2003 |
2004 |
2005 |
2006 |
2007 |
2008 |
|
Composting/recycling |
71 |
74 |
83 |
93 |
103 |
104 |
103 |
105 |
108 |
|
Energetic valorisation |
395 |
389 |
385 |
360 |
360 |
355 |
350 |
351 |
346 |
|
Elimination |
27 |
29 |
16 |
13 |
14 |
13 |
15 |
13 |
14 |
|
Total |
493 |
492 |
484 |
466 |
477 |
472 |
467 |
468 |
467 |
Source : IBGE based on data coming from the Agence régionale pour la propreté
The treatment of waste from enterprises in the Flemish Region.
Key message
The waste production by enterprises has increased since 2000. In 2007 the first treatment of the major part (56%) is pretreatment. The proportion of waste from enterprises landfilled decreased between 2000 and 2007.
Figures
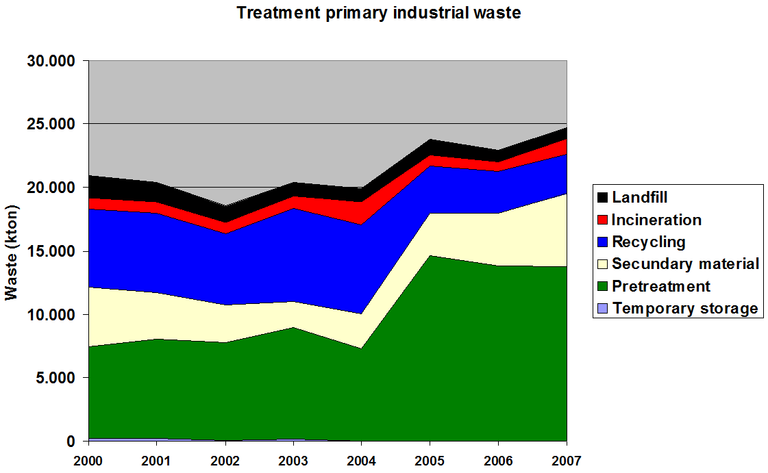
Figure 4: Treatment of primary industrial waste in the Flemish Region
- Data source
- http://www.ovam.be/jahia/Jahia/cache/off/pid/176?actionReq=actionPubDetail&fileItem=2159
Fullscreen image Original link

Waste from enterprises includes waste from the trade and services sectors. Primary waste results at the moment a product becomes waste for the first time, i.e. at the first producer. Secondary waste is excluded for this indicator. The figures are calculated by extrapolation of reported data.
In 2007, 36 % of the primary industrial waste went directly to recycling or use as secondary raw materials, 5 % went directly to incineration and 3 % went directly to landfills. The remaining 56 % of the primary industrial waste was pre-treated or conditioned first. Examples of conditioning are sorting, compaction, compression and thickening. The conditioned waste is ultimately also used as a secondary raw material, recycled, incinerated or landfilled.
Secondary waste arises at waste treatment companies, who sort, recycle, incinerate… existing waste. 40 % of this secondary waste goes to recycling, 20 % to landfill or incineration. The additional 40 % undergoes a second pre-treatment step before going to final treatment.
As an approximation, one can say that after two treatment steps, 57 % of the primary waste goes to recycling, 9 % goes to landfilling and 11 % goes to incineration. The additional waste is pre-treated several times.
The shift in 2005 between recycling and pre-treatment occurs due to a reclassification of waste treatment facilities and due to the fact that waste producers report only the first stage in the waste treatment chain. This results in a high percentage of pre-treatment.
The treatment of industrial waste in the Walloon Region.
Key message
The recovery rate of waste generated by extractive, large and medium-sized manufacturing and energy production industries varies between 80% and 90%. The proportion of waste landfilled decreased between 1995 and 2007.
Figures
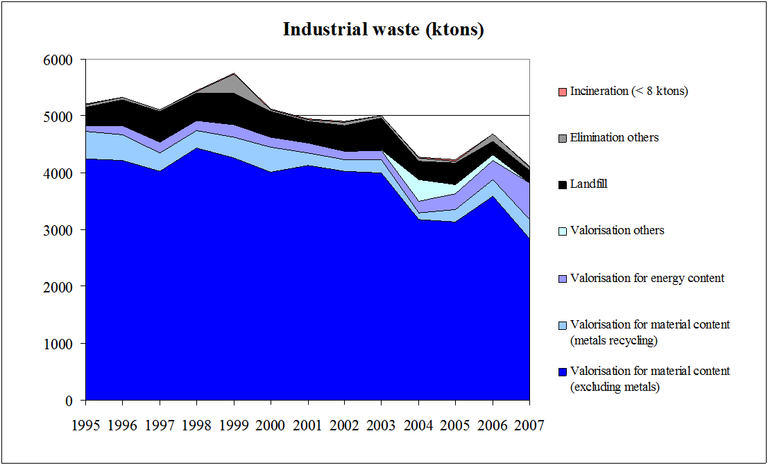
Figure 5: Treatment of primary industrial waste in the Walloon Region
Fullscreen image Original link

The amount of industrial waste generation per treatment is based on a sample of the extractive, manufacturing and energy production industries in the Walloon Region and is not extrapolated to the whole Walloon industry.
In the Walloon Region, the percentage recovery from waste generated by large and medium-sized manufacturing and energy production industries is estimated to vary between 80 % and 90 % (in the period 1995 to 2007). Such waste is largely valorised for its materials content. In 2007, about three-quarters of industrial waste were recovered from the sectors of metallurgy, chemistry and food (with a recovery rate above 85 %).
The treatment of industrial waste in the Brussels-Capital Region.
Key message
Industrial waste generation is estimated between 1,5 to 2 millions tons, often sent to treatment out of the Region.
Data sources
- Bruxelles Environnement (IBGE)
- Leefmilieu Brussel (BIM)
- L'état de l'environnement bruxellois
- Staat van het leefmilieu in Brussel
- "Summary report of the state of the environment 2007-2008" p.27
- "Synthese van de staat van het leefmilieu 2007-2008" p.25 (Dutch)
- "Synthèse de l'état de l'environnement 2007-2008" p.25 (French)
The Brussels-Capital Region is characterised by a reduced industrial sector (10 % of the enterprises) compared to the service sector (almost 90 % of the enterprises) and a predominance of offices (340 000 employees) and SME (95 %). Industrial waste generation is therefore reduced.
A rough estimation assesses the industrial waste generation between 1,5 to 2 million tonnes in the Brussels-Capital Region. This estimation is based on a compilation of data derived from different sources: composition analysis, application of ratio from literature for different sectors, use of collector data, etc. However, due to the different sources of data, double counting is possible (for example: waste produced by offices and schools can be collected by the public operator).
Industrial waste is often only sorted and sent to treatment plants outside the Region, leading to a lack of data about treatment once waste has left the Region.
Estimation of the waste produced by the industrial sector in the Brussels-Capital Region (ktons)
|
Construction and demolition waste |
650 |
|
Industrial waste |
500 |
|
Office waste |
100 |
|
Incineration residues |
137 |
|
Sewing slude |
123 |
|
Commercial waste |
80 |
|
Transport sector waste |
40 |
|
Health waste |
40 |
|
Hotel, restaurant and café waste |
35 |
|
School waste |
35 |
|
Total in ktons |
1 750 |
Those estimates are based on various sources, which is why the year of reference is not the same for the different waste categories (main sources: ’Estimation des quantités de déchets non ménagers générés et traités à Bruxelles - RDC environnement – 2006’, ’Evaluation des flux de déchets pour le secteur des bureaux - RDC Environnement –2008’ and annual reports of the Agence Régionale pour la propreté).
The recycling rates of packaging waste in Belgium.
Key message
The recycling percentage of packaging waste increases from 62% in 1997 tot 80% in 2007.
The control of the packaging waste is coordinated by the Interregional Waste Packaging Commission, which was founded by the three regions. As a result, national amounts of packaging waste are reported below.
1997-2002: Recycling in percentage of waste arising
2003-2007: recycling rates: recycling of packaging waste within or outside Belgium/generation of packaging waste in Belgium|
|
1997 |
1998 |
1999 |
2000 |
2001 |
2002 |
2003 |
2004 |
2005 |
2006 |
2007 |
|
GLASS |
70 |
66 |
75 |
80 |
85 |
93 |
96,2 |
97,5 |
99,9 |
99,8 |
100,0 |
|
PLASTIC |
25 |
26 |
24 |
25 |
28 |
29 |
32,5 |
36,5 |
38,1 |
38,6 |
38,4 |
|
PAPER AND FIBRE BOARD |
78 |
83 |
70 |
82 |
86 |
78 |
79,2 |
83,4 |
83,3 |
89,1 |
92,0 |
|
METALS |
70 |
66 |
72 |
70 |
81 |
86 |
92,6 |
91,0 |
88,5 |
93,2 |
91,4 |
|
COMPOSITES |
30 |
38 |
46 |
54 |
56 |
63 |
|
|
|
|
|
|
WOOD |
53 |
53 |
39 |
34 |
60 |
55 |
59,5 |
64,1 |
65,4 |
63,8 |
71,5 |
|
OTHER |
0 |
19 |
0 |
5 |
8 |
4 |
1,5 |
1,7 |
2,3 |
2,8 |
3,3 |
|
TOTAL |
62 |
64 |
59 |
63 |
71 |
70 |
73,9 |
76,4 |
76,8 |
79,0 |
80,4 |
Source: http://ec.europa.eu/environment/waste/packaging/data.htm
Since 2003 no composites had to be reported to the European Commission and since 2005 a new method is used to calculate the recycling percentage. This method also takes into account renewable packaging. For paper and fibre board, glass and metals, the recycling percentage is higher than 80 %, glass packaging is even fully recycled. For plastic, the recycling percentage stays approximately the same, around 38 %, and wood packaging reaches a maximum in 2007 (71 %). The total recycling percentage increases to 80 % in 2007.
